Diagrammatic Narration
Navigation is never natural; it is always the expression of a set of cultural assumptions and controls; it is a form of telling that sometimes carries semantic content, but always structures its expression within the constraints of presentation.
– Johanna Drucker
An interface presents semantic or narrative units along with graphic devices that provide legible markers for navigation and for establishing hierarchy. In a blog, for example , the segmentation, links, headers, date and time stamps, navigation bars, borders, margins and gutters are not content in themselves, but do the work of framing and ordering content and relations between content.
According to Johanna Drucker, graphic devices are integral to reading and understanding all narrative texts. One begins a book by looking over the table of contents, assessing the length and count of chapters and sub-chapters. A book's graphic devices continue to act as "narrative scaffolding" throughout the reading experience. This quick way of taking stock of a book's spatial structure does much cognitive work to prepare for reading. Drucker also observes that graphic devices often assist the reader in the production of narrative by modeling "the discourse field in ways that constraint or engineer the narrative possibilities for a reader." A book's spatial and navigation structure supports the reader's sense of chronology, causality, suspense and momentum.
Unlike the codex, database narratives are not structured as the precise ordering of narrative elements (pages). Narrative emerges as an effect of navigation. In a commercial website, the user is treated with – and often expects – an array of choices and paths; the interface offers macro and micro views of content and content relations that can stimulate a user's curiosity and desire for more micro-levels of reading/scanning. Graphic devices are narrative to the extent they activate an "urge for meaning, closure or resolution of an experience."
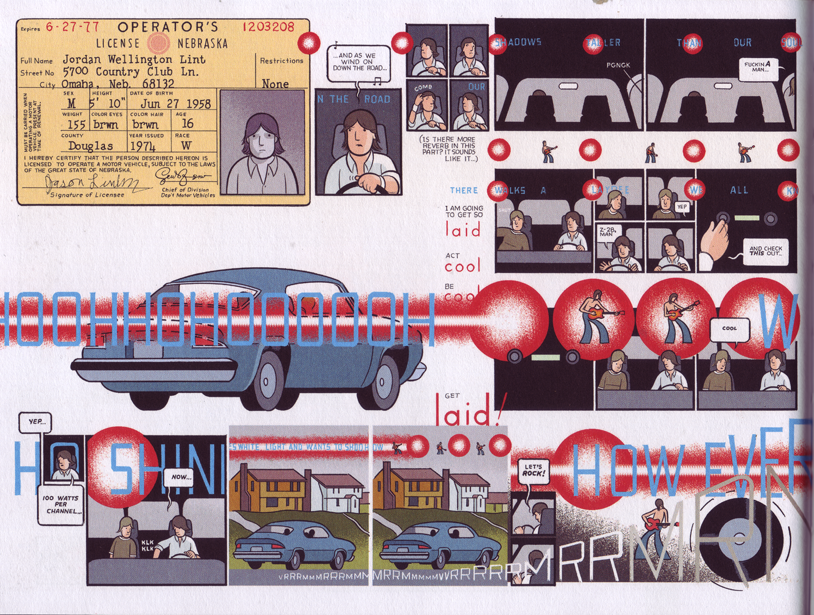
Chris Ware's unique diagrammatic style of storytelling demonstrates the role of graphic devices as tools for the reader to co-produce narrative. To "read" the pages of Lint – to follow lines of continuance, typographic hierarchies, series and grids, panel proportions – is to engage in a complex, distracted and distributed seeing. Ware presents moments in the day-to day lives of his characters, but they are events that are graphically interrupted or disturbed by past or imagined events. Abstract and emotional mental process such as reflection, comparison, speculation, projection are here displayed as relational panels, nested frames, radial and linear sequencing, repetitions and isolation.
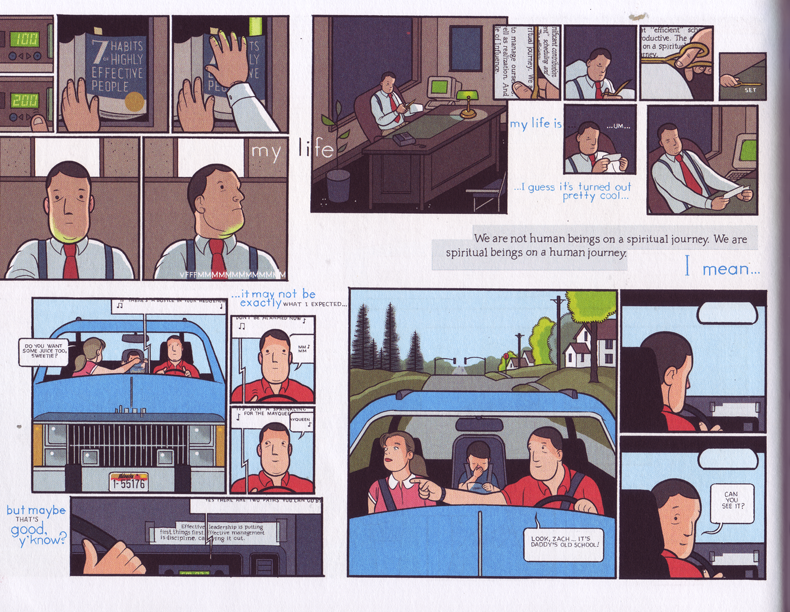
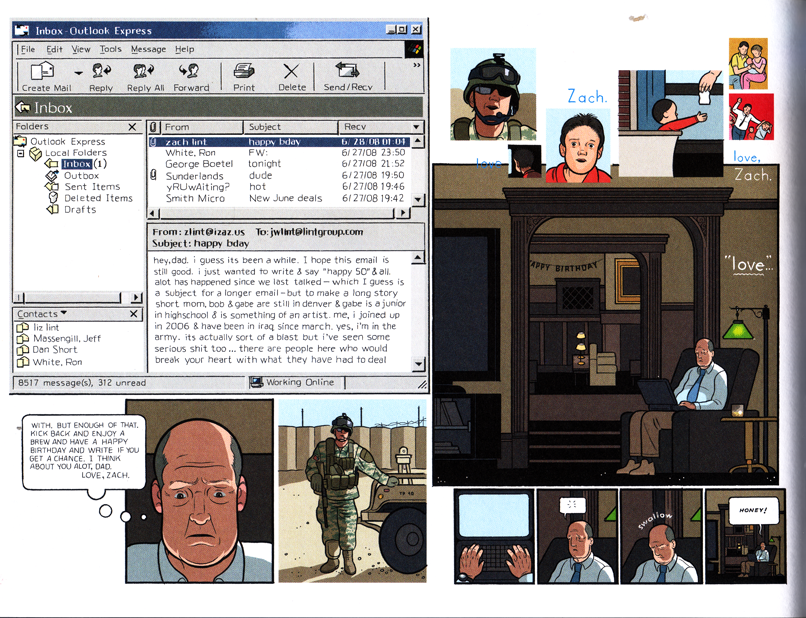
Ware's one electronic work, published as an iPad app, shows how well his graphic/narrative sense translates into database narrative. Perhaps his own displeasure with the project (he will likely not repeat it) also indicates that his dense pictorial style works very well with the narrative constraints of the book. The forward momentum provided by the book's graphic and material structure is a counter balance to the inward spiral of each page. Ware's graphic novels are not light-reading. They are emotional charts of characters in a de-narrativized world. Ware's graphic style includes mimetic gestures, but the organization of place and time is anything but mimetic. These pages are interfaces onto networks of thought; semiotic spaces that need to be traversed and narrativized by the reader to be received as narrative.
Chris Ware's unique diagrammatic style of storytelling demonstrates the role of graphic devices as tools for the reader to co-produce narrative. To "read" the pages of Lint – to follow lines of continuance, typographic hierarchies, series and grids, panel proportions – is to engage in a complex, distracted and distributed seeing. Ware presents moments in the day-to day lives of his characters, but they are events that are graphically interrupted or disturbed by past or imagined events. Abstract and emotional mental process such as reflection, comparison, speculation, projection are here displayed as relational panels, nested frames, radial and linear sequencing, repetitions and isolation.
Ware's one electronic work, published as an iPad app, shows how well his graphic/narrative sense translates into database narrative. Perhaps his own displeasure with the project (he will likely not repeat it) also indicates that his dense pictorial style works very well with the narrative constraints of the book. The forward momentum provided by the book's graphic and material structure is a counter balance to the inward spiral of each page. Ware's graphic novels are not light-reading. They are emotional charts of characters in a de-narrativized world. Ware's graphic style includes mimetic gestures, but the organization of place and time is anything but mimetic. These pages are interfaces onto networks of thought; semiotic spaces that need to be traversed and narrativized by the reader to be received as narrative.
| Previous page on path | Plotting the Database, page 5 of 8 | Next page on path |
Discussion of "Diagrammatic Narration"
Add your voice to this discussion.
Checking your signed in status ...